Belief #1: dSTORM is too difficult for non-microscopists
While dSTORM is an advanced imaging technique, getting started has been made easier with an increasing number of protocols for sample preparation1, extensive fluorophore testing2 for effective on-off photoswitching, and new more intuitive and user-friendly imaging and analysis software. Importantly, commercial dSTORM setups are available that eliminate the need for microscope building expertise and can be implemented in any kind of research lab or facility.
At ONI, our mission is to simplify super-resolution workflows by supporting the imaging needs from consumables and imaging technology all the way to data analysis. This includes removing the barrier of complex optical tables or alignment of microscopes. ONI’s Nanoimager is designed to be placed on any lab bench, without a dark room or complex maintenance procedures to follow, which often require expert handling.
What is the easiest way to get started with dSTORM?
- Make sure to understand the basic requirements of dSTORM, particularly for preparing an optimal sample. This includes understanding why the dye choice is important, how the labeling protocol differs from standard microscopy techniques (surprisingly not so much!) and understanding the best conditions for optimal signal-to-noise. Much more detailed information on getting started in super-resolution imaging can be found in our blog article here. For an introduction to single-molecule localization microscopy from a more technical perspective we further refer the reader to an excellent review.3
- The best way to gain expertise in dSTORM is by imaging. Practice dSTORM with a standard protocol and sample before exploring your own research question. Imaging a cellular structure, such as actin or the nuclear pore complex, can help you gain confidence in understanding good dSTORM conditions. Need further guidance? The new ONI Training Kit™: dSTORM provides all the materials needed for your first dSTORM image along with a step-by-step protocol and training videos to guide you through sample staining, imaging and analysis.
- Once you are familiar with the fundamentals, we recommend trying dSTORM with your samples and targets of interest, using validated reagents. To this end, the ONI Discovery KitTM: dSTORM in Cells provides a full kit of reagents to help you prepare samples for two-color dSTORM with optimal reagents and an user-friendly protocol.
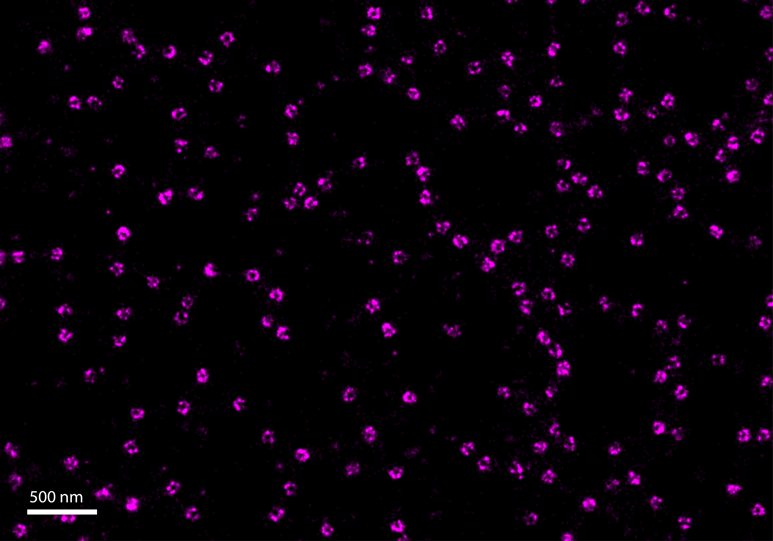
Figure 1. Nuclear pores imaged using the ONI Training Kit TM: dSTORM, which provides a simple workflow for new and existing users to learn the fundamentals of single-molecule localization microscopy.
Belief #2: dSTORM is too time-consuming
There is the perception that super-resolution imaging needs a long time to obtain your image. While dSTORM might not be as instantaneous as diffraction-limited fluorescence, the time required to obtain your image can be similar to those in a good confocal microscopy image.
To obtain a dSTORM image, data is collected one molecule at a time, which requires the acquisition of many frames of the same field of view. With the Nanoimager, data is built up in real time, so that you can easily assess the image being acquired. Post acquisition data analysis might take longer, as that is the crucial step where meaningful quantitative data is being obtained. This would be the equivalent to other quantitative assays or techniques. Importantly, once you have your labeling and conditions sorted, imaging time can be considerably reduced.
How much time one acquisition really takes depends on the structure to be reconstructed and the sample preparation optimization. While a typical dSTORM image of a cellular structure can be achieved in the time frame of 5-20 minutes, smaller structures like extracellular vesicles (EVs) can be imaged in 3 colors for as little as 3-4 minutes! Furthermore, with a good sample preparation and labeling protocol, it is possible to acquire thousands of EVs in one single field of view, reducing considerably the time required to obtain good statistics for EV analysis. If you are looking for an optimized EV imaging protocol, you might benefit from trying the ONI EV Profiler Kit.
Belief #3: dSTORM dyes are special so they are difficult to access and purchase
dSTORM dyes have special characteristics: under certain conditions they stochastically turn off and on generating a photoswitching (or blinking) behavior. But did you know that dSTORM compatible dyes were evaluated from a group of commonly used organic dyes?2 Many of these dyes were already used broadly in conventional fluorescence microscopy before their photoswitching behavior was understood. For example, using Alexa Fluor® 647 in combination with the appropriate dSTORM buffer can lead to beautiful super-resolved images. Other commonly used dSTORM dyes come from the ATTO fluorescent labels4 or fluorescent CF® dyes5. A complete list of recommended dSTORM dyes can be found here.
Nowadays, there are many options to purchase your biomarker or antibody of interest conjugated already with dSTORM compatible dyes. An example is the use of secondary antibodies labeled with Alexa Fluor® 647 dyes to stain any species compatible primary antibody targeting your structure of interest in a cell.6 In other cases, primary antibodies for common cell targets can be commercially purchased with Alexa Fluor® 647 for direct immunolabeling and dSTORM imaging. The ONI Discovery Kit: dSTORM in Cells can be very helpful in this scenario, as it includes validated secondary probes with best-in-class dSTORM fluorophores which will work against your favorite anti-mouse, rat or rabbit primary antibodies. This has been leveraged to detect low expression biomarkers of interest in cells.7
Can’t find the labeled probe you are looking for? Using commercially available protein labeling kits it is now easy to label any protein or antibody of interest using dSTORM compatible dyes8. These protocols are usually based on a straightforward NHS ester reaction of the dye to primary amine targets of the protein of interest.
Belief #4: dSTORM is only for biologists
While dSTORM is widely used in biology, it's not limited to this field. Researchers in materials science, chemistry, and physics also benefit from its nanoscale imaging capabilities. For example, dSTORM is emerging as a tool to understand synthetic materials such as nanoparticles, polymers or supra-molecular fibers.9
An interesting example includes the characterization of core-shell nanoparticles or microgels. Microgels are functional materials with a size around the diffraction limit of light. Using dSTORM, the structure and size of microgels can be elucidated, revealing the positioning of functional groups of interest within the nanostructure.10
Furthermore, the versatility of dSTORM can be leveraged for an interdisciplinary understanding of materials with the biological environment. In this context, researchers investigated the stability and trafficking of polymeric nanoparticles inside of cells to understand the potential of applying this kind of nanoparticles for drug delivery.11
Belief #5: dSTORM just provides you with a pretty picture
Undeniably, we are in love with dSTORM images: from cells to extracellular vesicles and from organelles to molecules, life has become a little less blurry with the introduction of single-molecule techniques (in fact 10 times less blurry!). But the beauty of dSTORM lies in its quantitative potential.
Tools such as filtering, clustering and segmentation are routinely used for quantitative analysis of dSTORM images. This has allowed researchers to gain information regarding size, density distributions or clustering behavior of structures of interest12. In cells, quantitative dSTORM is used for example to extract information on the organization of membrane receptor proteins. This includes investigating membrane clustering to determine the homogeneity of cellular membranes.13
For smaller structures, such as extracellular vesicles, the quantitative nature of dSTORM allows you to distinguish different populations based on their biomarker positivity. This tool allows researchers to better understand this relatively new kind of biological material, from structure-function relationships to potential applications in drug delivery.
For more examples and applications on quantitative super-resolution microscopy, we recommend rewatching our previous Tips & Tricks webinar on ‘Extracting Meaningful Data from Super-resolution Images’.

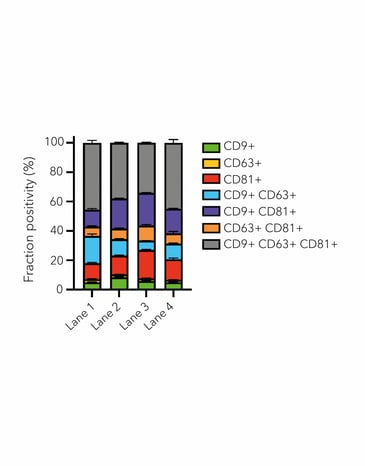
Figure 2. ONI’s EV Profiler Kit allows detection of up to 3 biomarkers on captured EVs. HCT116-derived EV sample were captured with ONI’s S4 molecule, labeled with anti-CD9-CF®488 (yellow), anti-CD63-CF®568 (cyan) and anti-CD81-CF®647 (magenta) and imaged using dSTORM on the Nanoimager (left). Biomarker positivity was quantified using ONI’s CODI cluster-based algorithm on single-molecule localization microscopy data (right).
How do I get started with super-resolution imaging?
We are here to help! We recommend exploring our dSTORM Training Kit to learn the basics of single-molecule localization microscopy, and the dSTORM Discovery Kit to label your favorite proteins in different cell types. You can also browse our website for technical articles, learning resources, and publications that have used our technology on different biological applications.
ONI is on a mission to change this by making super-resolution microscopy more accessible and easy to use. We want to help researchers worldwide access the powerful technology that can allow them to see and understand the world surrounding us with the greatest possible level of detail. Join us in exploring the nanoscale world and pushing scientific boundaries with cutting-edge technology! For any queries and sales support, contact our team at hi@team.oni.
References
- Jimenez, A., Friedl, K., Leterrier, C. About samples, giving examples: Optimized Single Molecule Localization Microscopy. Methods, Volume 174, Pages 100-114 (2020), ISSN 1046-2023, https://doi.org/10.1016/j.ymeth.2019.05.008
- Dempsey, G., Vaughan, J., Chen, K. et al. Evaluation of fluorophores for optimal performance in localization-based super-resolution imaging. Nat Methods 8, 1027–1036 (2011). https://doi.org/10.1038/nmeth.1768
- Lelek, M., Gyparaki, M.T., Beliu, G. et al. Single-molecule localization microscopy. Nat Rev Methods Primers 1, 39 (2021). https://doi.org/10.1038/s43586-021-00038-x
- https://www.atto-tec.com/ATTO-488.html?language=en
- https://biotium.com/technology/cf-dyes/cf-dyes-for-super-resolution-microscopy/
- Woythe, L., Madhikar, P., Feiner-Gracia, N., Storm, C., Albertazzi, L. A Single-Molecule View at Nanoparticle Targeting Selectivity: Correlating Ligand Functionality and Cell Receptor Density. ACS Nano 16 (3), 3785-3796 (2022). https://doi.org/10.1021/acsnano.1c08277
- Nerreter, T., Letschert, S., Götz, R. et al. Super-resolution microscopy reveals ultra-low CD19 expression on myeloma cells that triggers elimination by CD19 CAR-T. Nat Commun 10, 3137 (2019). https://doi.org/10.1038/s41467-019-10948-w
https://www.thermofisher.com/order/catalog/product/A20006 - Pujals, S., Feiner-Gracia, N., Delcanale, P. et al. Super-resolution microscopy as a powerful tool to study complex synthetic materials. Nat Rev Chem 3, 68–84 (2019). https://doi.org/10.1038/s41570-018-0070-2
- Gelissen, A.P.H., Oppermann, A., Caumanns, T., Hebbeker, P.,Turnhoff, S.K., Tiwari, R., Eisold, S., Simon, U., Lu, Y., Mayer, J., Richtering, W., Walther, A., Wöll, D. Nano Letters 2016 16 (11), 7295-7301. DOI: 10.1021/acs.nanolett.6b03940
- Riera, R., Tauler, J., Feiner-Gracia, N., Borrós, S., Fornaguera, C., Albertazzi, L., ChemMedChem 2022, 17, e202100633.
- Wu, Y.L., Tschanz, A., Krupnik, L., Ries, J. Quantitative Data Analysis in Single-Molecule Localization Microscopy. Trends Cell Biol. 2020; 30(11):837-851. doi: 10.1016/j.tcb.2020.07.005. Epub (2020). PMID: 32830013.
- Letschert, S., Göhler, A., Franke, C., Bertleff-Zieschang, N., Memmel, E., Doose, S., Seibel, J. and Sauer, M. Super-Resolution Imaging of Plasma Membrane Glycans. Angew. Chem. Int. Ed., 53: 10921-10924 (2014). https://doi.org/10.1002/anie.201406045