SPT is a powerful technique that follows the mobility of individual particles in living cells or within a medium to determine the trajectories, mobility, behaviors and interactions of these particles over time. Single particles can include molecules, proteins, virions, or vesicles. Tracking their trajectories can provide critical insight on the dynamic behavior of individual particles or large macromolecular complexes.
Fluorophores for labeling single particles
There are different approaches for labeling particles for tracking experiments, including fluorescent proteins (FPs), organic dyes, dye-labeled antibodies, and nanocrystals such as quantum dots. In SPT, it is the fluorophore attached to the particle that is followed over time.
When choosing the best labeling approach, consider the size of the fluorescent molecule, the location of the target to be labeled (intracellular versus extracellular vs non-cellular), the image acquisition settings (laser power, exposure time, duration) and the labeling method. We provide more details below:
1. Density of labeled particles in the sample
- SPT is performed optimally with single particles that are spaced far enough apart. This can be achieved by imaging biological molecules that are intrinsically at an optimal density or by labeling only a subset of the particles to be tracked if the concentration of particles is high.
- If particles are spaced too closely together, identifying individual particles can be challenging using single-molecule localization techniques.
- Linking the positions of a moving particle between frames can create artificial tracks when several particles are found present in the same pixel or surrounding pixels, which could confuse the tracking algorithms that are based on nearest neighbor calculations.
- Photoactivatable light microscopy (PALM) can be harnessed for SPT studies. Photoactivatable dyes can be used to selectively activate a subset of the labeled particles using near UV light.
- Photoactivatable dyes from the Janelia Fluor HaloTag ligand dye family provide excellent photostability and brightness and can be used to track HaloTag fusion proteins.
- Photoactivatable fluorescent proteins (FPs) such as PA-GFP or photoconvertible FPs such as mEOS and Dendra2 can also be used to tag proteins for sptPALM.
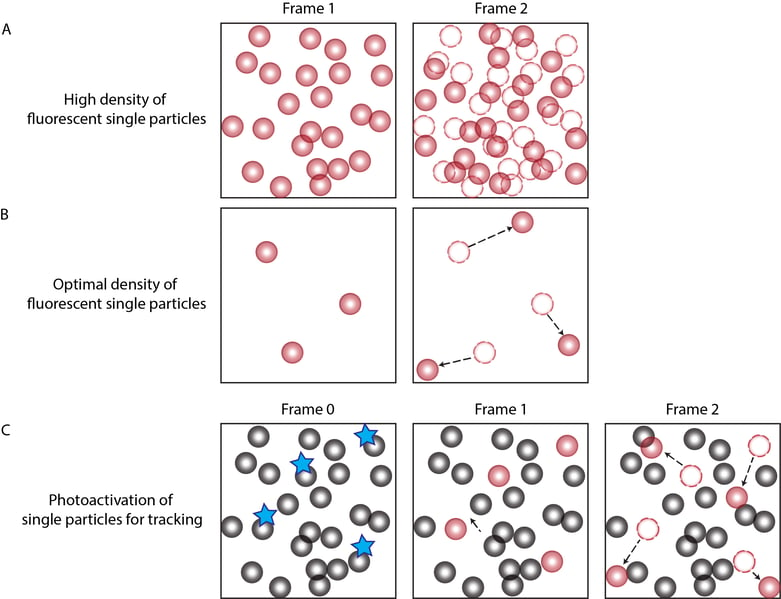
Figure 1. The concentration of labeled particles is important for determining particle trajectories. (A) A high density of fluorescent particles results in inaccurate tracks due to overcrowding and erroneous linking of each particle’s position from frame to frame. (B) An optimal density of fluorescent single particles is characterized by single particles that are spaced sufficiently apart so that the position of each particle can be accurately recorded from one frame to the next without other particles occupying the nearby space of the tracked particle. (C) When the concentration of particles is high, photoactivatable fluorophores can be used to activate the fluorescence of a subset of labeled particles using UV light followed by tracking the photoactivated fluorescent particles.
2. Size of the fluorescent tag
- Steric hindrance from an attached fluorophore may interfere with the mobility and/or biological functions of some particles.This inhibition from steric hindrance can sometimes be corrected by incorporating a long and flexible linker between the FP and the protein of interest.
- An option for labeling cell surface markers such as transmembrane proteins in the plasma membrane is to use antibodies, antibody fragments or camelid nanobodies of various sizes to label the extracellular domain of these proteins to track their lateral mobility or internalization and trafficking inside the cell.
- All tagged particles should be verified for proper function and molecular interactions when interpreting imaging results and describing biological behaviors.
Several tags of various sizes are available for labeling single particles, here are some common fluorescent labels for SPT and their sizes:
| Labeling method | Size | Reference (list below) |
| Organic dye | 1-2 nm | 1 |
| Nanobody | 2.5 nm | 2 |
| Fluorescent protein | 2.5 nm | 1 |
| HaloTag | 3.3 nm | 3 |
| F(ab) | 5 nm | 4 |
| Antibody | 10 nm | 5 |
| Quantum dots | 10-30 nm | 1 |
3. Fluorophore brightness
- Ideally, the fluorophore used for tagging should be bright and remain bright for the duration of imaging and be resistant to photobleaching. Consider the quantum yield, brightness and fluorescence lifetime of the fluorophore.
- See FPbase (https://www.fpbase.org/) for a comprehensive library of FPs and their photophysical properties.
- The photostability and brightness of fluorescent probes starting with the best is: quantum dots > organic dyes > fluorescent proteins.
4. Labeling methods
- Fluorescent proteins fused to proteins of interest can be introduced into cells on a plasmid vector via transfection for transient expression or packaged into viruses for stable expression via transduction.
- The best method for performing SPT of cellular proteins is to use CRISPR-Cas9 technology to knock in the FP adjacent to the gene encoding the endogenous protein to avoid any biological effects of recombinant protein overexpression.
- Protein overexpression can detrimentally impact cellular functions, such as overloading biological pathways, aggregating proteins, and disrupting the regulatory functions of the target protein.
- Instead of FPs, proteins fused to HaloTag can enhance imaging due to the advanced brightness, versatility and photostability of Janelia Fluor dyes for SPT.
- Commercially-available kits can also be used to label proteins on the extracellular face of cells, purified proteins, antibodies and oligonucleotides using modified dyes.
- Oligonucleotides can be synthesized by commercial companies to be tagged with fluorescent dyes at their 3’ or 5’ termini or commercial labeling kits can be used to tag DNA molecules.
![]()
![]()
Figure 2. PDZD8 protein (red) and mitochondria (green) labeled in COS-7 cells. PDZD8 tracks (color-coded based on the diffusion coefficient) show the protein walking along the ER. Data from Dr. Xufeng Wu, NIH Bethesda, US.
Many options are available to researchers in probe selection for single particle tracking experiments, whether live-cell imaging or cell-free tracking in a medium is performed. Importantly, the Nanoimager can handle a variety of fluorescent probes and provides an efficient analysis workflow that enables researchers to easily obtain accurate tracking data to gain functional insights.
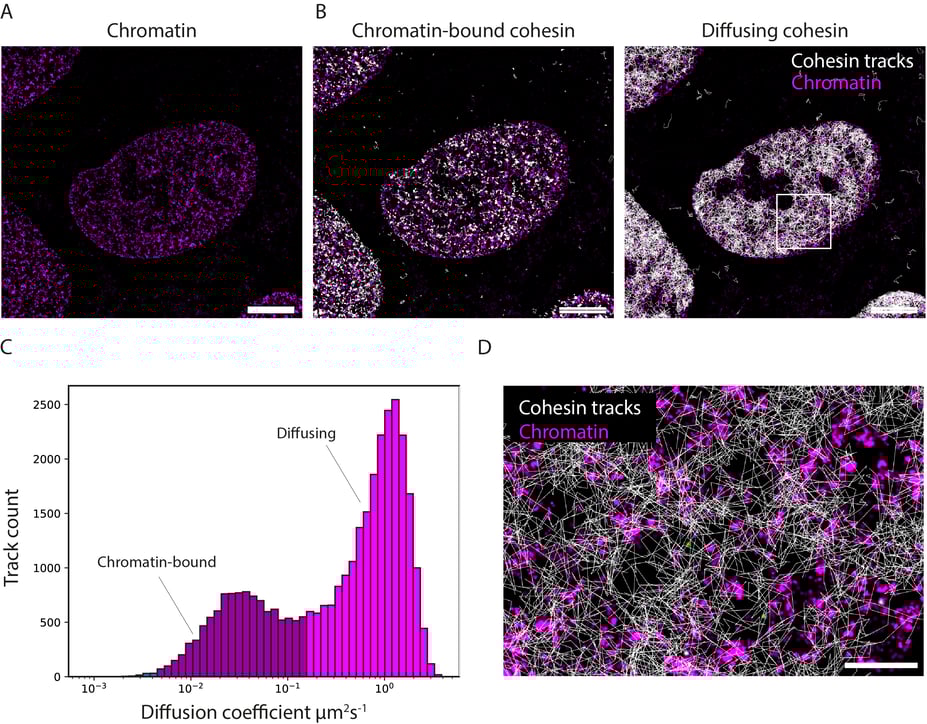
Figure 3. SPT of cohesin on chromatin in U2OS cells. (A-B) U20S cells expressing Dy505-SNAP-H3 (chromatin) and SCC1/Rad21-HaloTag labeled with JF549 Halo ligand. Shown is a maximum time projection image of Dy505-SNAP-H3 captured at time 0 s overlaid with the cohesin tracks (shown in white) generated from the time lapse images in NimOS. (C) Graph shows the binned distribution of diffusion coefficients in the chromatin-bound and the diffusing populations, and the number tracks in each bin. (D) Magnified view of the white inset in (B). Scale bars: 1 μm in (A) and (B), 0.2 μm in (D).
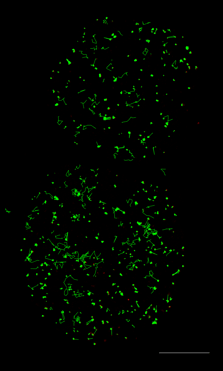
Figure 4. Tracking JF549-tagged H2B in the nuclei of MCF7 cells. Left panel shows a video of H2B imaged at 100 Hz played back at 20 FPS. Right panel shows tracks of H2B particles built from the localizations in the middle panel. Scale bar is 10 µm. Image courtesy of Dr. Arpita Upadhyaya and Vishavdeep Vashisht, University of Maryland, US.
To explore how the Nanoimager can empower your SPT experiments and for more information on selecting the best fluorescent probes for your research, reach out to marketing@oni.bio and discover additional resources at oni.bio/resources/oniversity.
You can also download our Technical Guide - Getting started with Single Particle Tracking following this button:

References
1. Shen H et al. Single Particle Tracking: From Theory to Biophysical Applications. Chem Rev; 117, 11: 7331–7376 (2017).
2. Shuyang S et al. Nanobody: A Small Antibody with Big Implications for Tumor Therapeutic Strategy. Int J Nanomedicine; 16: 2337-2356 (2021).
3. Yazaki J et al. HaloTag-based conjugation of proteins to barcoding-oligonucleotides, Nucleic Acids Research; 48, 2: e8 (2020).
4. Hainfeld F. A small gold-conjugated antibody label: improved resolution for electron microscopy. Science7; 236, 450 (1987).
5. Reth, M. Matching cellular dimensions with molecular sizes. Nat Immunol 14, 765–767 (2013).