Like every year, ONI launched their annual EV competition at the ISEV conference. Since we were already familiar with their technology (from our collaboration with the Gene Machines group led by Prof. Achilles Kapanidis at the University of Oxford), we wanted to try first hand whether this was something that our lab could benefit from. That is why we decided to submit a research proposal to complement our bulk EV measurements for validating different cancer-specific biomarkers.
We were excited to hear that we were selected as the Europe winners for the 2022 EV competition edition. This became a reality earlier this year, when a team from ONI came to KU Leuven to install the system, train us how to use it in the context of EV research – an aspect that was new to us – and showed us the possibilities the platform (consumables, microscope and software) can offer for EV research, and beyond.
Our research using the Nanoimager
Once we had the system in place, we performed some tests for the ongoing projects on single-molecule study of DNA origami and DNA enzymes (DNAzymes). Focusing on the DNAzymes, they are short DNA strands able to perform chemical reactions and, in our case, those that cleave the phosphodiester bond between two RNA bases in the presence of Mg2+.
The main goal of this project was to study the functional heterogeneity of DNAzymes at the single-molecule level. Thanks to the labeling of the substrate and DNAzyme sequences we were able to identify the cleavage events, differentiate the release of the two product sequences and study behavior of DNAzymes at different concentrations of their crucial catalytic cofactor Mg2+ by imaging using single-molecule Förster resonance energy transfer (smFRET) and alternating laser excitation (ALEX) (Figure 1). The possibility of studying the DNAzymes at the single-molecule level allowed us to obtain novel information on the functional diversity among DNAzymes, and the possible challenges we might encounter when developing applications that rely on a small number of DNAzymes, such as digital biosensors. Furthermore, thanks to the TIRF imaging mode of the Nanoimager, we managed to record hundreds of DNAzymes simultaneously, making the imaging process faster.
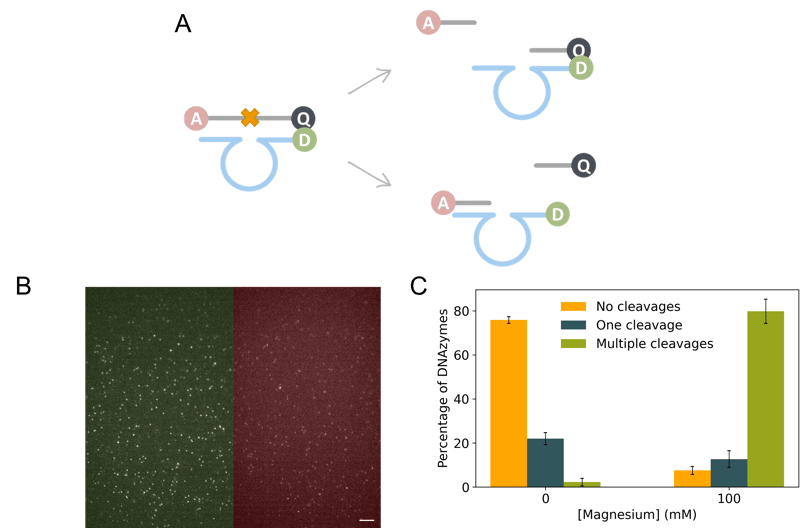
Figure 1. smFRET study of RNA-cleaving DNAzymes. A) Schematic representation of the DNAzyme reaction and the labeling strategy. The DNAzyme (blue) is labeled with the donor (D), while the substrate (gray) is dually labeled with the acceptor (A) and a quencher (Q). The DNAzymes contain two substrate binding arms, adjacent to the catalytic core, which bind the substrate. The hybridization of the DNAzyme and the substrate leads to the cleavage of the phosphodiester bond between the RNA bases positioned in the middle of the substrate sequence (depicted with an orange cross). After cleavage the product sequences are released and the DNAzyme can initiate a new reaction cycle. B) Example of a recording, which is split into two halves, displaying the emission of both the D and A channels (left and right part of the image, respectively). Scale bar is 5 µm. C) Classification of the DNAzymes based on the number of cleavage events at 0 mM or 100 mM of Mg2+, the reaction cofactor. The error bars represent the standard deviation of three independent repetitions.
In parallel, we explored the capability of the Nanoimager for the imaging and characterization of EVs. Initially, we tested isolated EVs from human breast cancer cell lines and recombinant EVs1, which were stained with three antibodies against tetraspanins on the EV surface (i.e. CD81, CD63 and CD9). More specifically, we used EVs from the SK‑BR‑3 cell line and the measurements were performed both in buffer and diluted plasma (by detecting HER2 biomarkers on their surface), which resulted in highly comparable results.
Encouragingly, the measurements in plasma showed low signal for the negative control (i.e. in the absence of EVs). In this context, we tested two different strategies: (1) capturing the EVs by using a biotinylated anti-HER2 antibody and performing staining for 3 different tetraspanins (i.e. CD81, CD63 and CD9), and (2) capturing the EVs via phosphatidylserine while staining for HER2 and two tetraspanins (i.e. CD63 and CD9). Without any extensive optimization, we managed to successfully capture and stain EVs expressing HER2 proteins on their surface following either of the approaches (Figure 2). Furthermore, thanks to the visualization of the three biomarkers colocalization, we could grasp an idea of how they are arranged on the surface of the EV.
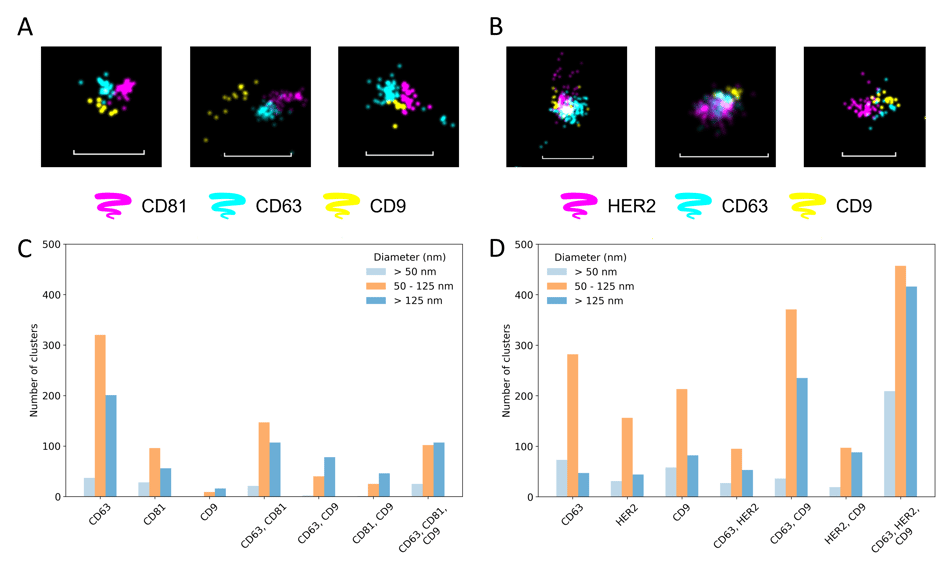
Figure 2. Detection of HER2 biomarker on SK-BR-3 EVs in diluted plasma. A) and B) Screenshots of clusters showing triple positivity for both protocols tested: (1) capturing the EVs via biotinylated anti-HER2 antibody and staining for 3 different tetraspanins (i.e. CD81, CD63 and CD9), and (2) capturing the EVs via phosphatidylserine and while staining for HER2 and two tetraspanins (i.e. CD63 and CD9), respectively. Scale bars are 200 nm. C) and D) Classification of the clusters identified based on the biomarker positivity and the size for the first and second approach, respectively.
Finally, we also tried capturing EVs in cell culture supernatant after limited sample preparation steps. Interestingly, compared with the measurements of the isolated EVs, we observed a much narrower size distribution and a higher circularity, together with a larger number of EVs in the field of view. Thus, besides showing that it is possible to acquire super-resolution images with only a few sample preparation steps, this platform could be employed to characterize the impact of the isolation techniques on the EV morphology.
What impressed us the most ONI’s system
What we were reassured about during this 3 months’ period is how user-friendly the ONI’s Nanoimager is compared to other super-resolution imaging systems, even when starting to explore a new application area. After some basic training, all the users were able to handle the platform with very little microscopy expertise needed. We also received amazing support from ONI’s technical team. We’d like to thank Peter Drent and Dr. Lara Laparra in particular for their fantastic assistance throughout this period.
We collected a lot of information in a limited time frame, some of which we expect to publish shortly!
Having the ONI’s Nanoimager platform with us for 3 months allowed us also to have scientists from other research groups to try the system, not only for EV imaging but also for smFRET and single-particle tracking. They all agreed about the strengths of this platform, being the simplicity of sample preparation, handling the device and the fact that a super-resolution image can be obtained in less than 5 min.
We would like to encourage other scientists in need of super resolution microscopy to apply for this year’s competition and get a chance to experience ONI’s platform first hand and for free for 3 months!

----
If you are keen to learn more about Nanoimager and how the ONI products can help your research, visit get in touch with us at hi@team.oni.